
Data has become one of the most valuable assets in the world during this digital age. It has found applications across business, science, and industry, from monitoring as simple as that of customer behavior to scientific research and operational improvement. This is why knowing how to collect, analyze, and interpret data has become so valuable today.
Why are tools for data collection important?
Nowadays, gaining meaningful and evidence-based data can be considered the fundamental concept of any enterprise, research, and organization. Whether you are including information that delights customers, making forecasts out of data, or just making it clear to other people—the tools for data collection you choose can be the deciding factor.
With the technologically driven advances in the field, a variety of platforms have come into existence that will make you discover, analyze, and interpret various types of data in exciting ways.
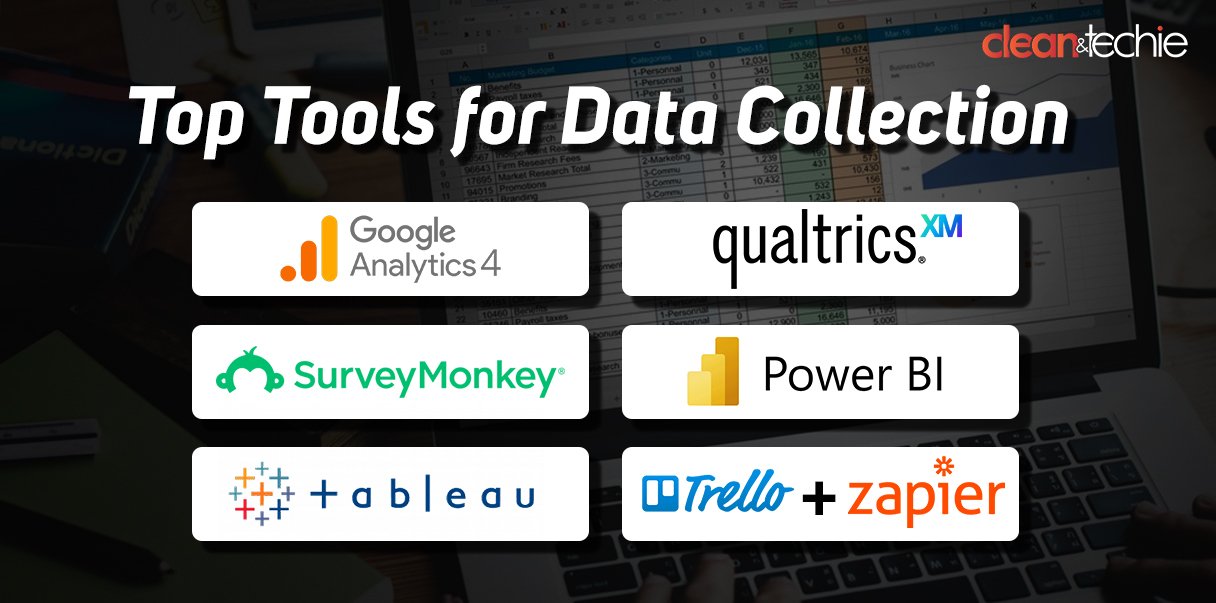
We will address the developments with this post, introducing some of the best data collection tools for data collection in 2025—their features, advantages, and how they are essentially changing the way we collect information. Web analytics, surveys, and sophisticated business intelligence platforms are undeniably the hottest tools for data collection out there in the era of data collection’s digital turnaround.
Key Statistics for Leading Data Collection Tools in 2025
| No. | Tool | Additional Stats |
| 1 | Google Analytics 4 | GA4 processes over 10 trillion hits per month. Over 50% of websites use GA4 for tracking. |
| 2 | SurveyMonkey | Conducts over 10 million surveys each day. 30% of Fortune 500 companies use SurveyMonkey. |
| 3 | Tableau | Tableau has $2.3 billion in annual revenue (2023). Over 1.2 million users in more than 100 countries. |
| 4 | Qualtrics | Qualtrics is used by 90+% of the top 50 global brands. Managed over 1 billion surveys globally. |
| 5 | Microsoft Power BI | Power BI is used in over 180 countries. The free version is used by over 8 million users worldwide. |
| 6 | Trello + Zapier | Zapier processes over 100 million tasks per month. Trello boards are used by 65 million+ users globally. |
1. Google Analytics 4 (GA4)
GA has been a general tool for web analysts for many years, and the current system, Google Analytics 4 (GA4), takes it a step further by integrating more advanced features in data collection and insights.
More than 50% of websites now use GA4, making it the most adopted web analytics tool globally. This shift to event-based tracking provides a more granular view of user behavior, allowing businesses to understand their audience across multiple devices and platforms in ways traditional pageview metrics couldn’t capture.
Key Features:
- Event-based tracking: Instead of pageviews, GA4 focuses on events, helping users gain more precise insights into user interactions.
- Cross-platform tracking: Utilize one dashboard for collecting both information from websites and mobile applications.
- AI-driven Insights: GA4 contains machine-learning models that predict user behavior, such as churn probability and purchase intent.
Stats:
- As of 2023, there are already over 30 million websites globally using GA4, and the rate of adoption is following an upward trajectory.
- Google reports that over 80% of marketers use some form of analytics to track traffic on their websites and predicts that GA4 will become the predominant force by 2025.
Pros:
- The free version is as good as any paid version.
- It can also be easily integrated with other Google products, such as Ads, Tag Manager, etc., and offers very high-quality reports and AI-powered predictions.
Cons:
- It’s very complicated for starters to get familiar with.
- Customization is a real shortage of the free version.
Use case:
This is a must-have tool for all digital marketers, e-commerce players, and content creators if they are after a detailed database of user interaction trends across web and mobile platforms.
2. SurveyMonkey
Surveying is one of the most effective ways to gain insight directly from users, customers, and employees. SurveyMonkey is the leading web-based software for creating and distributing customizable online surveys. It offers a reliable and secure way to collect and analyze feedback. Its ease of use, coupled with highly customizable survey options, allows users to gather insightful data for everything from market research to employee satisfaction.
Trusted by major companies, including 30% of Fortune 500 businesses, it offers a reliable and secure way to collect and analyze feedback. Its ease of use, coupled with highly customizable survey options, allows users to gather insightful data for everything from market research to employee satisfaction.
Key Features:
- Templates options: It’s got a ton of customizable templates, like when you can choose templates or build your survey structure all by yourself.
- You get real-time analytics: live trends and responses, added together.
- Smooth integration: Easily integrates caboose with CRMs, Google Sheets, and many more.
Stats:
- 2024 SurveyMonkey has 20 million users worldwide.
- Using a survey regularly in business for feedback yields a 30 percent boost in customer satisfaction, as per SurveyMonkey research.
Pros:
- Drag-and-drop is enabled with many advanced features.
- Advantage: You can have what you call ‘advanced’ features such as logic-based and branching options.
- Comes with various analytics and reporting tools
Cons:
- Limited free option not exceeding 10 questions of survey.
- High for small companies.
Use case:
Surveys on SurveyMonkey can be put to use from structured feedback for business and marketing research up to broad audience reach, like in employee interest and customer satisfaction studies.
3. Qualtrics
Qualtrics does things a bit differently from the usual ways when it comes to experience management, integrating data collection to collect feedback from both customer and employee hands, which leads to an increase in brand sales and customer happiness within the business.
The platform manages over 1 billion surveys worldwide, providing organizations with the insights they need to optimize every aspect of their operations. From detailed customer feedback to real-time employee sentiment analysis, Qualtrics is designed to support experience management at a global scale.
Key Features:
- Multi-channel feedback: Receive feedback from sources like email, websites, mobile apps, and social media platforms, thus ensuring more interaction with people.
- Advanced analytics: Make the most of AI and ML to explore patterns and forecast future trends with a higher level of confidence.
- Custom survey creation: Design interactive surveys with logic, branching, and segmentation.
Stats:
- Qualtrics has around 14,000 clients worldwide who are the big names in the corporate world, including the top and the majority of them are in the Fortune 100.
- Once 2023 was over, it turned out almost 40% had the Qualtrics experience management platform in use by the end of 2023, while they only had a deployment in a handful of companies at the beginning of the year, which indicates the rapid pace of adoption.
Pros:
- High-quality customer experience service with powerful tools dedicated to this area of business.
- User-focused exceptional personalization features with the help of advanced data segmentation.
- CRM and gateway with helpful marketing tools and email platforms for seamless marketing of the products.
Cons:
- Around are the complexities related to the setup that can be lessened by breakthrough solutions somewhere.
- The annual price for these certifications is in the range of $1500-$1750; it can be quite expensive for firms that operate a small business.
Use Case:
Qualtrics can be easily adopted by a large company that is trying to collect feedback from different sources to master the entire lifecycle of the customer
4. Tableau
Tableau is one of the most advanced software programs designed for data visualization and predictive analysis, thanks to which users can evaluate, visualize, and comprehend huge sets of data.
Tableau is still the number one choice for companies to get insights from their data and make decisions, which resulted in the company’s annual revenue being more than $2.3 billion. A community of over 1.2 million users distributed across 100 countries has made Tableau’s data visualization features essential for organizations that want to perform effective decision-making processes.
As a result of the tool, the financial, health, and banking industries have been able to use data to their advantage.
Key Features:
- Powerful data visualization tools: You can create interactive boards and data visualizations that make data more accessible and actionable.
- Integration with numerous data sources: You can connect to databases, spreadsheets, cloud services, etc.
- Real-time data updates: The software allows for updates in real-time, thus it is most suitable for monitoring live data.
Stats:
- Tableau is used by over 86,000 organizations worldwide to turn data into actionable insights (at the time of the study).
- In 2023, a study showed that 94% of all Tableau users were more decisive, the result being the most dominant among those who reported improved decision-making as the most significant benefit of the platform.
Pros:
- Industry-leading data visualization capabilities.
- Highly customizable dashboards and reporting options.
- Strong community and resources for learning.
Cons:
- A steep learning curve for beginners.
- Expensive, with prices starting at $70 per user per month for the most basic plan (which should be improved, I think).
Use Case:
It is more efficient and effective for businesses, data scientists, and analysts who want to see data from multiple sources in real-time so that they can make data-driven decisions. It is good for businesses, data scientists, and analysts to analyze large amounts of data from different sources immediately, and by doing this, they make data-driven decisions about the use of the data.
5. Microsoft Power BI
Power BI is one of the best Microsoft Data Analytics tools that you can use in Microsoft Data Analytics. You are allowed to pull together a set of different data sources and create and share interactive reports and visualizations, etc.
Power BI has already turned into a necessary tool for business intelligence all over the world, and from 180 countries and different regions, people make use of it. With the use of the tool, it can be made one of the most commonly utilized data visualization and analytics applications on the market, with free users reaching over 8 million.
Being able to effortlessly integrate with other Microsoft products is what sets this software apart as a savvy choice for those businesses that already have a Microsoft-based system in place. These businesses can then utilize these insights to identify the main issues without much effort.
Key Features:
- Wide range of integrations: With Power Bl, you can connect to more than 100 data sources, combining solutions like Excel, SQL Server, and Azure.
- Custom visualizations: With Power BI, users can create a unique visual report, which would be the most convenient way to analyze the data and present it to the organization’s members.
- Natural language processing (NLP): Now, the system of Power BI is not only understandable to technical staff but also written in everyday English for use by people who are not technically trained.
Stats:
- Power BI has a 23.1% share in the business intelligence software market, based on the 2024 Gartner report.
- There are more than 250,000 organizations in the world that use it.
Pros:
- It is the company with the most affordable prices and also has a free version that can be used.
- Open Office is a customer of such products, which means tight integration with Excel and SharePoint.
- An advantage for anyone who is not IT-savvy is a friendly and smooth-to-learn environment.
Cons:
- A limited version is the problem; it lacks certain features.
- For those who are just starting, creating customization options might be a little bit challenging to master.
Use Case:
Power BI is the best choice for businesses that need affordable, scalable, and ready-to-use data analysis and visualization tools supported by Microsoft and need to be integrated into their existing environment.
6. Trello + Zapier (Automation for Data Collection)
If Google perceives it as a tool for automating data collection across multiple platforms, Trello and Zapier cloud integration will be the best decision. Trello, one of the numerous task management tools, along with Zapier’s automation capacities, can gather data from diverse sources and carry out workflows automatically.
Trello, with its 65 million global users, simplifies project management, while Zapier’s ability to connect it to other apps enhances its data collection and task management capabilities, making it an ideal tool for small businesses and teams looking to increase productivity.
Key Features:
- Workflow automation: Automatically move data between different tools, like, for example, collecting survey responses into a Trello board.
- Integration with over 2,000 apps: Join apps like Google Sheets, Slack, Mailchimp, and many others to make data collection quicker and more efficient.
- Real-time alerts: Get notifications on your phone, for example, for data events that are important to you.
Stats:
- Zapier boasts over 5 million users, who in turn process billions of tasks each month.
- Trello is used by more than ten countries, releasing more than 50 million people globally.
Pros:
- Simple to set up with a significant number of integrations that exist out there.
- Cost-effective free-of-charge options for small businesses at the basic level.
- Automates repetitive tasks and data collection without the hassle of manual input.
Cons:
- Restrictions in choices on free plans.
- Some integrations might require a certain level of expertise.
Use Case:
Trello and Zapier together are most suitable for small companies that have to automate data collection across various platforms and run tasks automatically without another tool for data collection being set up.
End Note
Acquisition of information is not an important aspect of decision-making only in the realm of education. The applications specified in the piece of writing above are effective for businesses and individuals in the collection, analysis, and taking of actions on data more than ever. If you are a digital marketer and are using Google Analytics 4, you can now easily get visiting statistics and consumer behavior analysis.
Obtaining survey responses can be an attractive strategy for a researcher who uses SurveyMonkey. That could be important if they are using Tableau to generate graphical patterns of extracted information in original content. In this case, the best gadgets can make a great difference in your ability to handle data for success improvement.
2025 will be about more sophisticated features that make the tools for data collection more unpredictable and dynamic. With the help of AI and machine learning, data collection will stay on the same path and lead to a data-driven future. Processing the data would be the best idea and grab the customer’s attention at the same time. Establish your brand, assist your customers, and usually, in the end, make your communication more effective.
FAQs about Top Data Collection Tools in 2025
1. What are the best tools for data collection?
Google Analytics 4 and SurveyMonkey are great selections for beginners. While GA4 allows you to track the website performance efficiently, SurveyMonkey allows one to generate simple surveys and obtain feedback from respondents, even those who do not have any IT resources or knowledge.
2. Which tool is best for visualizing data?
If the objective is to convert complex data to visual materials that are easy to understand, then Tableau and Microsoft Power BI are the best choices. These tools for data collection are full of great features and functionalities like (dynamic) visualization, and users can create very detailed and interactive dashboards very easily, making clear data analysis and the actions to be taken as a result very understandable to everybody.
3. Can tools for data collection be used by small businesses?
Yes, all those tools for data collection can be scalable and thus, can apply to small-sized businesses. Google Analytics 4, SurveyMonkey, and Trello (with Zapier) provide free or very cheap plans, making it easier for small teams to gather data and increase efficiency.
4. Are there free versions of data collection tools?
Many of the tools for data collection mentioned above come in free versions but with some feature limitations. Google Analytics 4 and Power BI, for instance, give out pretty good options without charging for registrations. SurveyMonkey and Trello also offer free versions with very few functions, which makes them best for short surveys or simple PM tasks.